Internet Usage Report 2024
Online trends from the pandemic are here to stay
Jun 10, 2024 | Share
Industry Exclusive/Entertainment
One of the big takeaways from our previous Internet Usage Report was how much the COVID-19 pandemic changed the way that people used the internet. Lockdowns, school closures, and abundant Zoom meetings increased people’s reliance on the internet, making it even more of a necessity than it had been before the pandemic.
In contrast, perhaps the biggest takeaway of this year’s survey is how little things have changed. Although many politicians and pundits were eager to declare the pandemic over, it seems that things won’t be going back the way they were before—at least in terms of internet use.
Key findings and trends
- Many post-pandemic trends continue. While many people reported a jump in their internet usage during the pandemic, online activities like streaming music and podcasts, online gaming, texting, and emailing have stayed at those levels. Preferences around online versus in-person activities also remained pretty consistent.
- Internet usage still seems to be increasing. Compared to last year, 41.4% of respondents said that their internet usage had increased. (Fewer than 9% reported a decrease in internet use). However, the average time respondents reported actively using the internet actually went down from eight to six hours per day, so take these estimates with a grain of salt.
- VR didn’t take off. Despite companies like Meta going all-in on virtual reality (and even rebranding the entire company), the number of respondents who used the internet for VR more than once throughout the entire year dropped from 31% to 25%.
- AI is the new hotness. While large language models like ChatGPT weren’t on our radar back in 2022, 37% of respondents reported using these sorts of generative AI multiple times last year. The most common use was as an alternative to standard web searches, which companies like Google are heavily leaning into at the moment.
People still like shopping in person
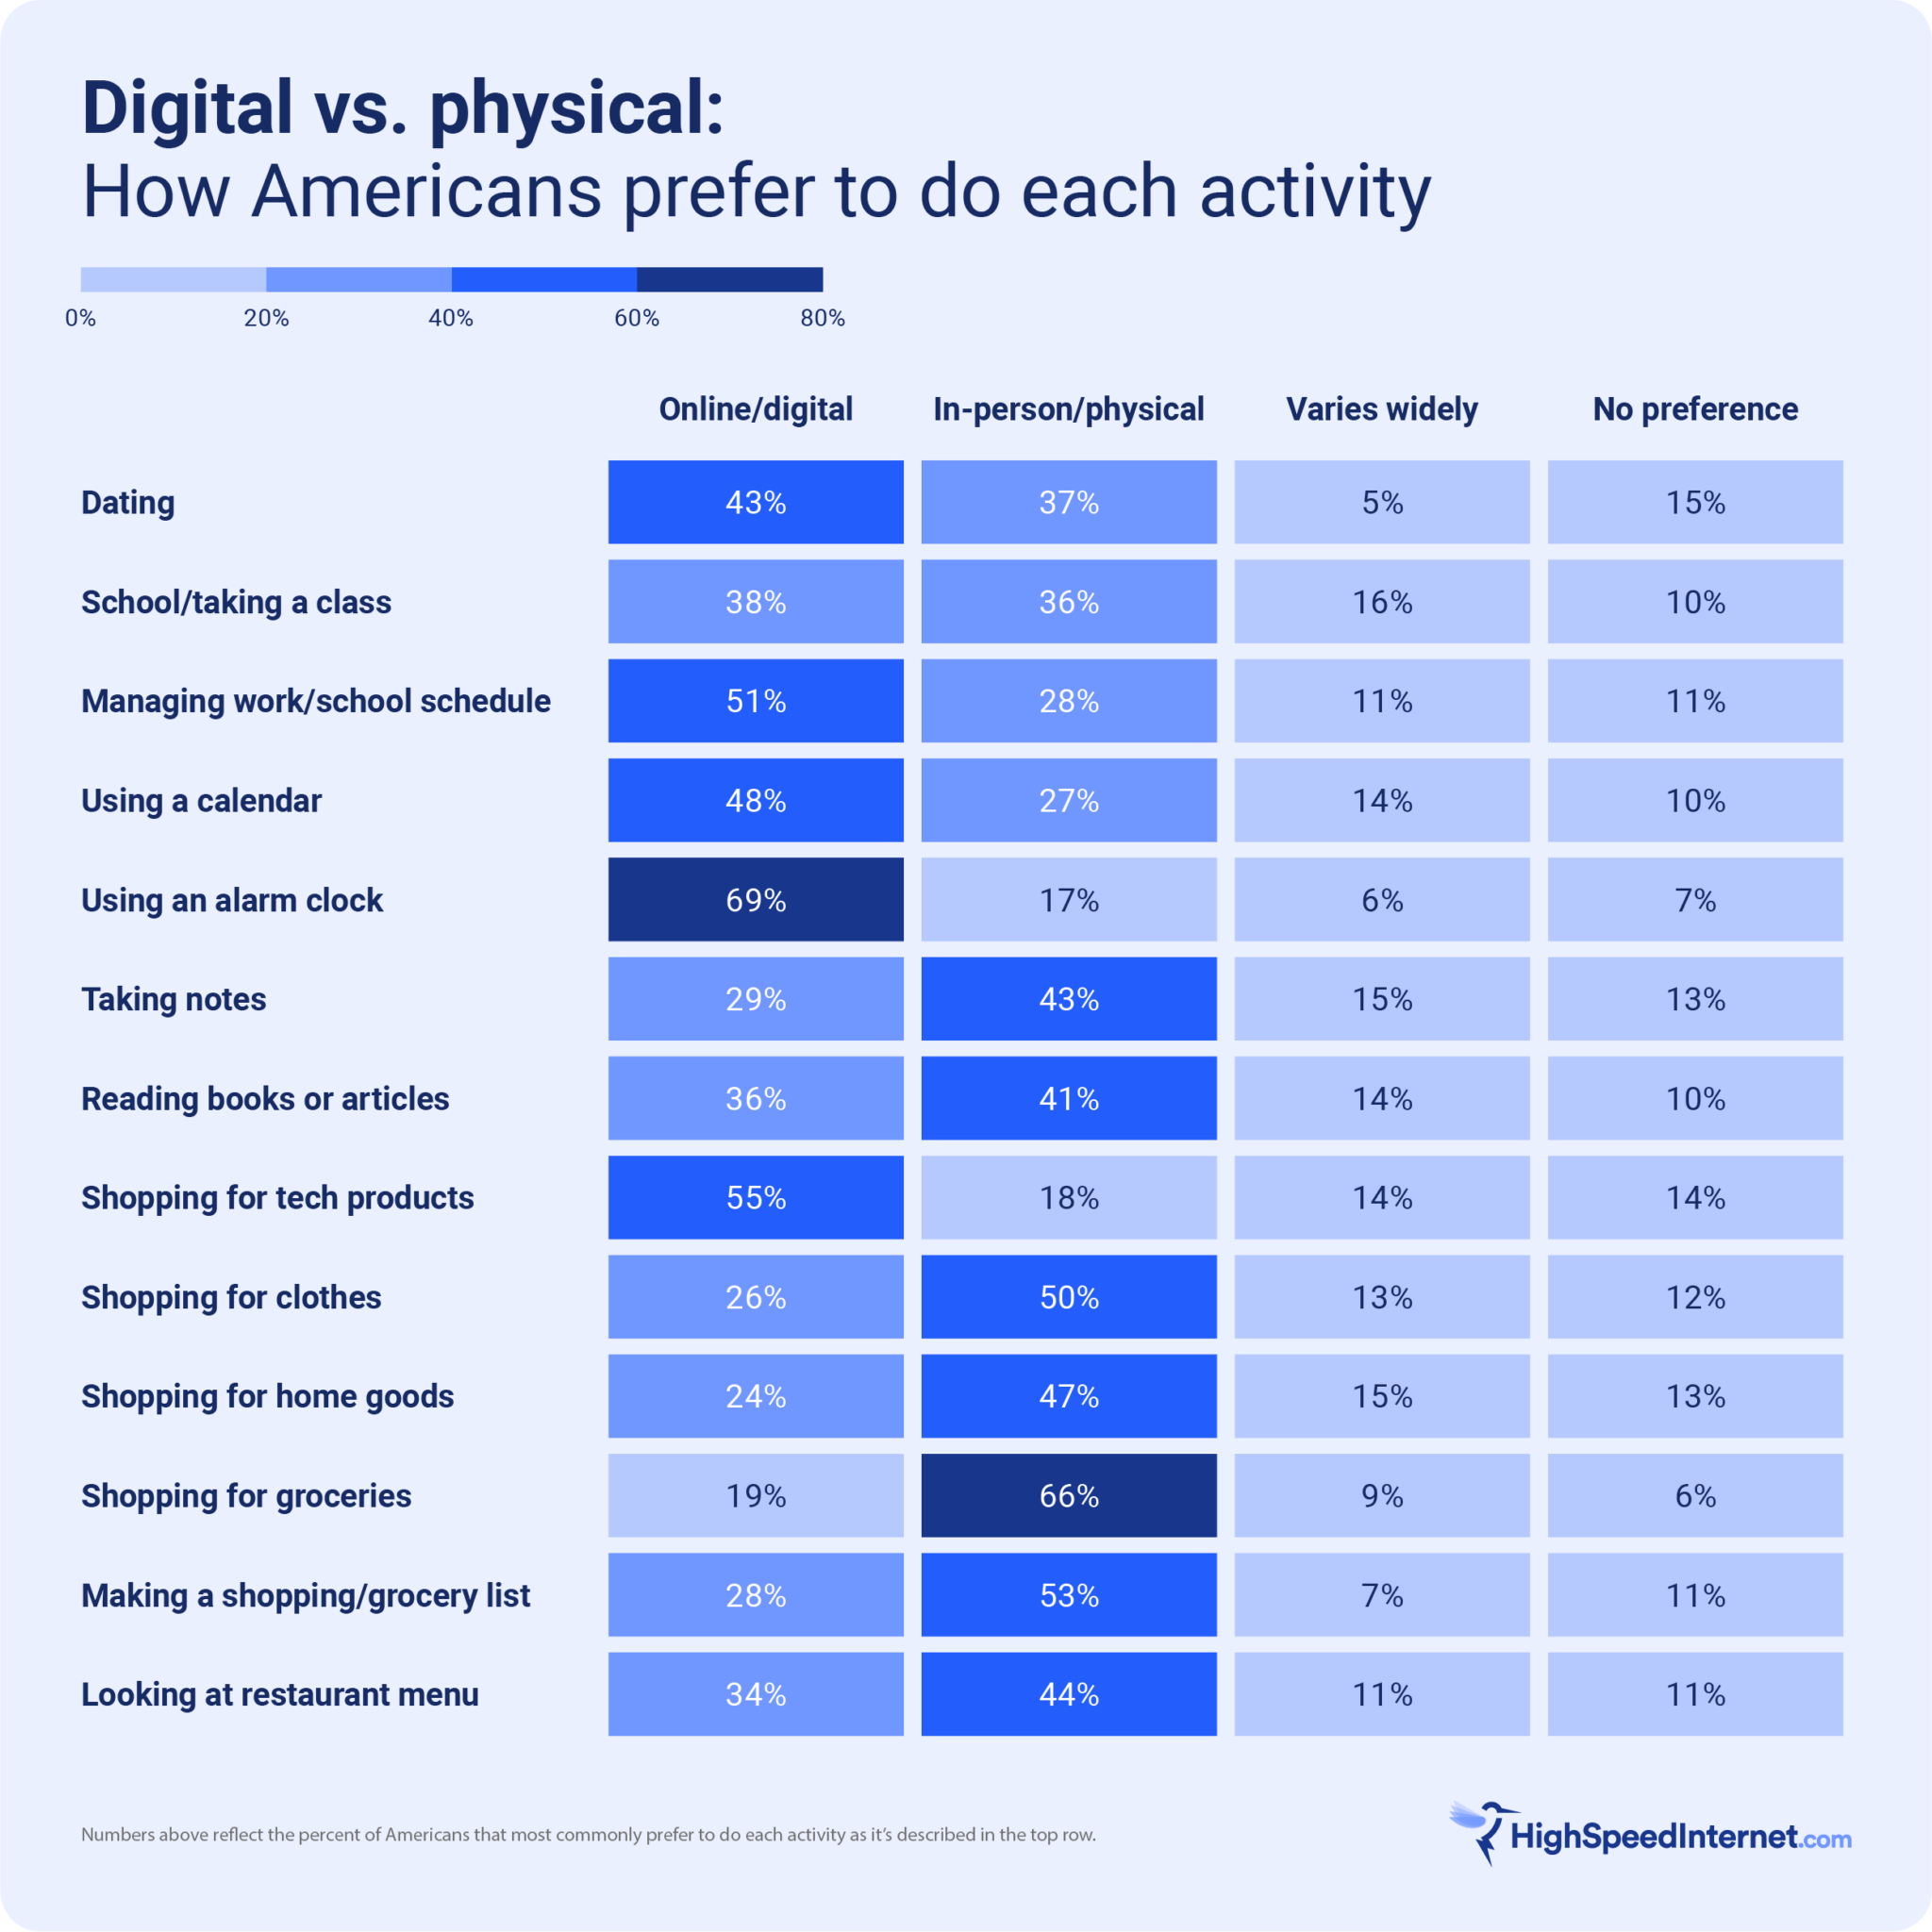
Much like in our last survey, shopping is one of the everyday tasks that people prefer to do in person, rather than online. Respondents preferred to shop for all the following items in person:
- Clothing: 48% (25% online)
- Home goods: 44% (23% online)
- Groceries: 64% (19% online)
Once again, the only category of shopping that people preferred to do online rather than going to a physical store was when purchasing tech products—48% of respondents preferred buying these items online as compared to only 15% who wanted to go to a physical store.
People might be warming to the idea of online dating
The number of people who prefer finding dates online increased slightly, from 14% in 2022 to 16% in 2024. This isn’t a huge shift, and it’s important to note that the number of people who prefer to look for romantic partners in person has held steady at 13%. The vast majority of respondents (64%) weren’t looking for dates at all.
People still prefer pen and paper to digital
Despite a wide selection of apps for almost any imaginable task, most people prefer physical pen and paper objects to their digital counterparts.
- Taking notes: 37% (25% who prefer online)
- Reading books and articles: 35% (30% who prefer online)
- Making a grocery list: 49% (26% who prefer online)
- Looking at a restaurant menu: 41% (31% who prefer online)
Once again, the major exception to this trend was calendars, scheduling tools, and alarm clocks, in which people much preferred digital solutions to their analog counterparts.
People are tired of online meetings
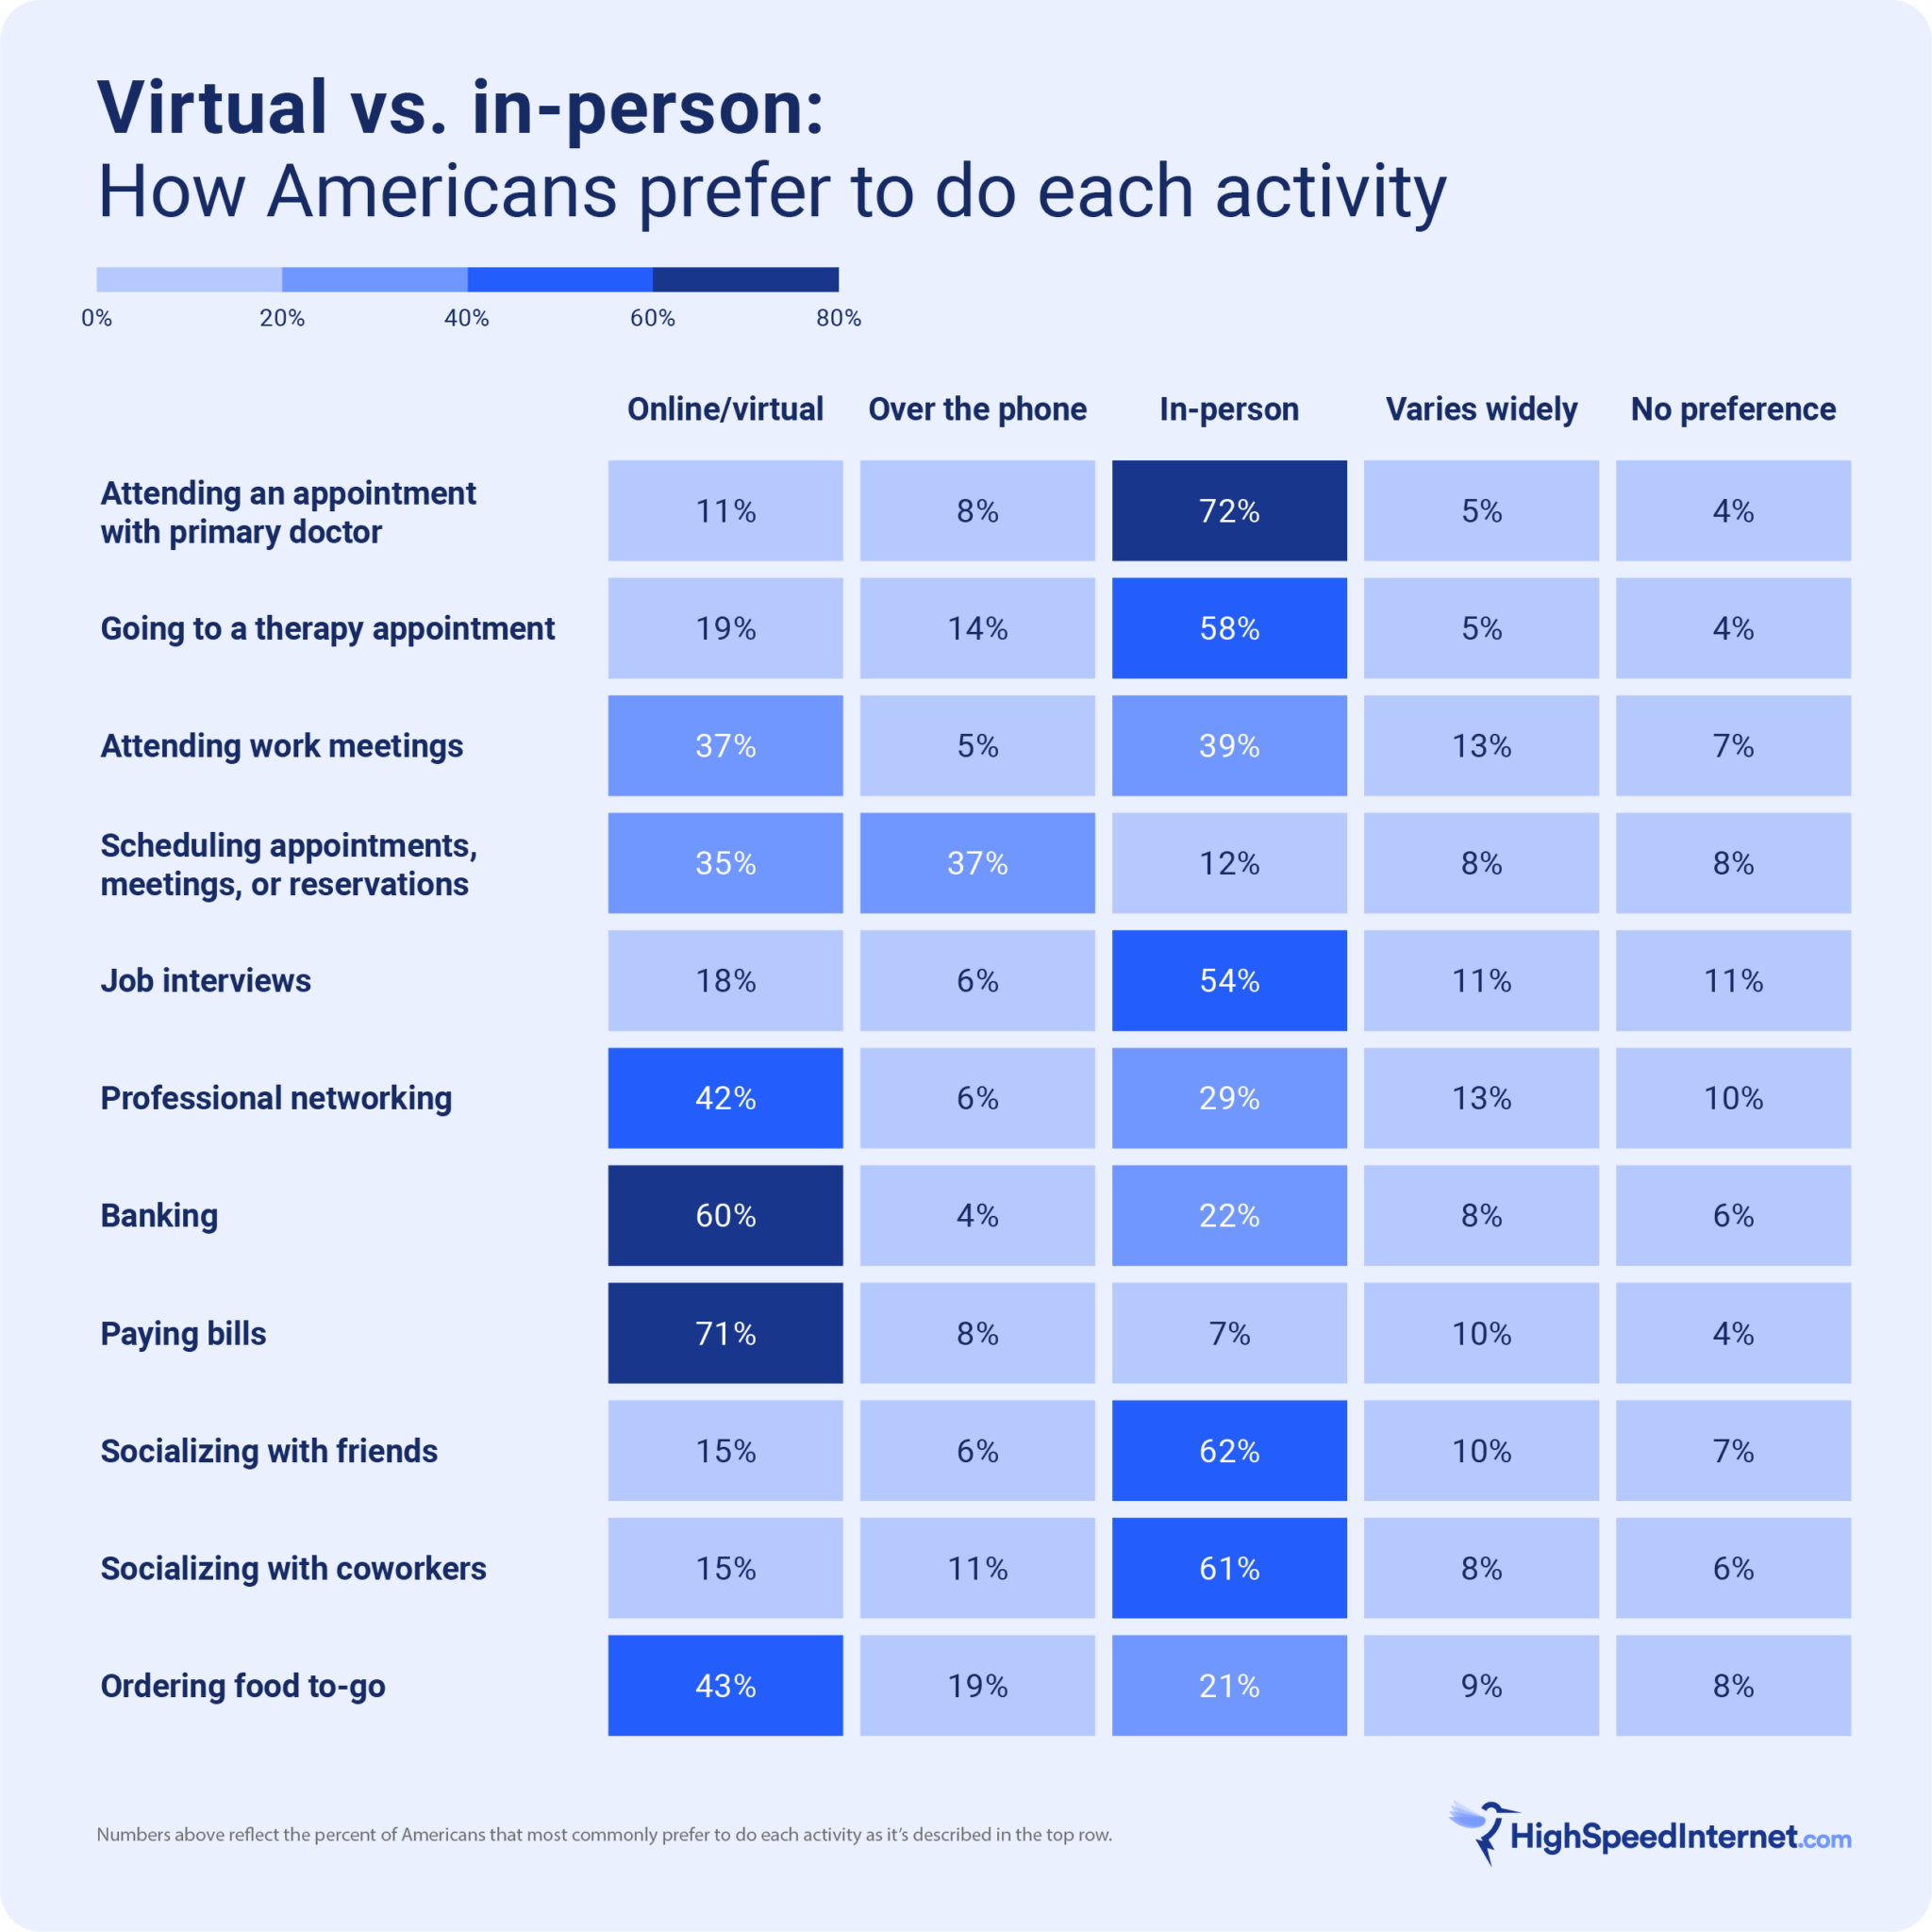
Corporate online interactions have shifted a little over the last two years. Preferences toward in-person work meetings have increased slightly, with the number of people who prefer attending meetings in person just barely taking the lead at 21% while 20% of people still prefer to do their work meetings online.
When it comes to health care, the majority of people still prefer to see their doctors in person. In fact, the number of people who prefer in-person visits has increased slightly to 68%.
VR is out, AI is in
When we took our last survey in 2022, tech companies were betting big on VR, with Facebook rebranding its entire company as Meta. But according to our survey, about 20% of the people who were using VR back in 2022 have an expensive headset collecting dust somewhere in 2024. Meanwhile, Meta lost more than $42 billion in its quest to reinvent Second Life 20 years too late.
The new hot tech in 2024 is, of course, AI, or more specifically, its large language models (LLMs) like ChatGPT and LLaMA. And if tech companies were excited about VR a few years ago, they’re absolutely crazy about LLMs today, with OpenAI, the maker of ChatGPT, valued at $80 billion.
Internet users are excited about LLMs as well. In this year’s survey, 37% of respondents reported having used AI tools multiple times in the last year, which is more than were using VR during our previous survey. This is perhaps unsurprising, since using an LLM doesn’t require spending several hundred dollars on an awkward hardware peripheral. Then again, at least the headset wasn’t telling anyone to put glue on their pizza or eat rocks.
While it is impressive that 37% of survey respondents are using a product that didn’t even exist last time our survey went out, that’s not exceptionally high, especially considering the fact that most people are just using AI as an alternative to Google Search. And Google has been trying hard to shove its AI responses in everyone’s face. Meanwhile, 25% of respondents are still using VR, despite the high barriers to entry, so I’m not so convinced that the current AI bubble is going to last long enough for tech companies to get back their massive investments.
People want to research products before buying
Among our survey respondents, 75% reported always or frequently researching products before buying them. Given the large number of careful comparison shoppers that we surveyed, a surprising 43% didn’t know that you could comparison-shop online for internet providers.
Internet service can be a pretty significant monthly bill for most households, but unlike utilities like water and electricity that are tightly regulated, internet service can vary wildly in both cost and quality between providers. While the FCC has recently made a number of changes to internet regulations to improve speeds, prevent hidden fees, and increase consumer protections, there’s still a lot of information to compare to ensure that you don’t end up overpaying for internet or signing up for a plan that doesn’t meet your needs.
Fortunately, comparing internet providers is what we do here at HighSpeedInternet.com, so if you’re looking for a new internet provider or just want to see how your current provider stacks up against the competition, this is a good place to start.
Do you need more speed to keep up with your online activities, or are you paying for more bandwidth than you actually use? Use our tool to find out how much internet speed you actually need.
Methodology
HighSpeedInternet.com ran a survey of 1,000 Americans age 18+ in May 2024, using the online survey platform PollFish. The results shown above are post-stratified. Post-stratification weighting method is a way to achieve a distribution equal with that of such known characteristics of the population. In this case, it was applied to age and gender. To determine year-over-year statistics, we compared these survey results to that of the same survey conducted in September 2022. If you have questions about the survey, methodology or data in this report, you can email them to press@highspeedinternet.com.
Author - Peter Christiansen
Peter Christiansen writes about satellite internet, rural connectivity, livestreaming, and parental controls for HighSpeedInternet.com. Peter holds a PhD in communication from the University of Utah and has been working in tech for over 15 years as a computer programmer, game developer, filmmaker, and writer. His writing has been praised by outlets like Wired, Digital Humanities Now, and the New Statesman.
