State of the Internet in 2023: As Internet Speeds Rise, People Are More Online
Sep 28, 2023 | Share ![]()
![]()
![]()
Data and Research, Industry Exclusive/Entertainment
Internet usage is increasing and people are spending about eight hours online every day. With more time online, Americans are questioning the speed and cost of internet. Meanwhile, the US faces a national digital divide that is only going to make it harder to stay connected in our increasingly online world.
We combed through our data and reports from the past year to determine the state of the internet for 2023. The verdict? We’re seeing some of the fastest internet speeds, but the rising cost of internet frustrates many customers. In our 2023 State of the Internet report, we’ll cover internet speeds in the US, how people are using the internet, and Americans’ wishlist for the perfect internet plan.

High-speed facts
- The East Coast is home to the fastest internet speeds in the US.
- We’re online more than ever, but still missing that in-person touch for some activities.
- Fiber internet reigns supreme and bundling is a hit for internet and mobile.
- Over half of Americans feel taken advantage of by internet providers.
- Where is the state of the internet going in 2023?
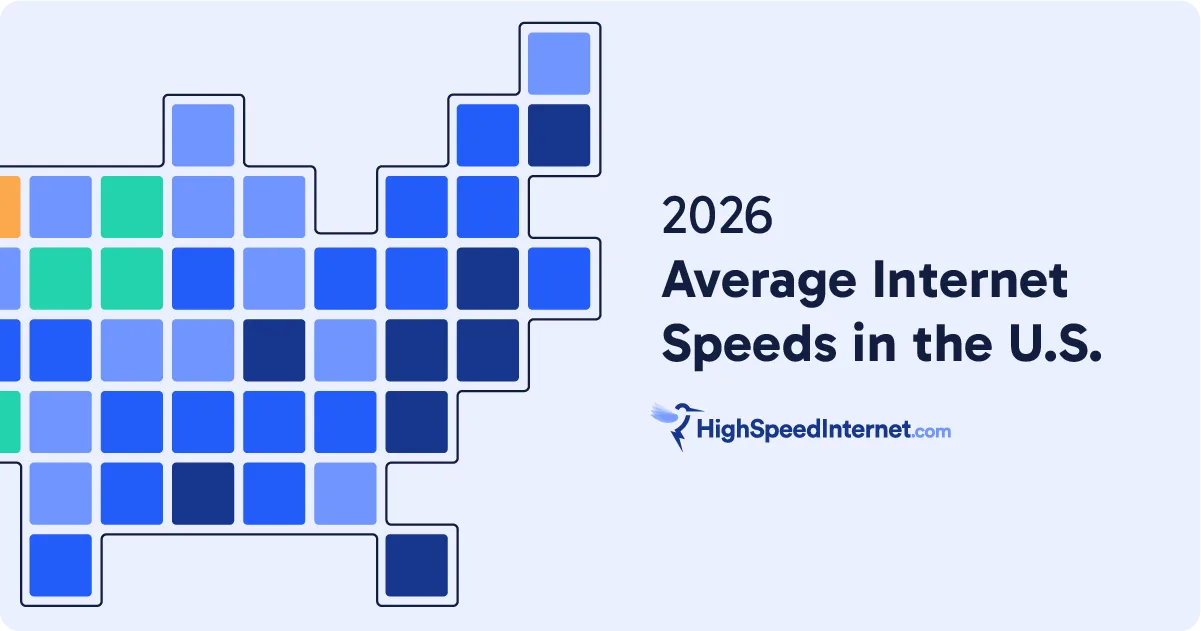
In 2022, internet speeds rose over 20% year over year to a national average of 119.03 Mbps, based on our HighSpeedInternet.com Speed Test. But depending on where you’re reading our State of the Internet report, you may be experiencing faster or slower speeds.
- The national average does not mean all states have equal speeds. Delaware has the fastest internet speeds in the US at an average download speed of 145.8 Mbps, beating West Virginia (slowest at 60.7 Mbps) by 2.4x.
- The East Coast is home to the fastest internet speeds in the United States with Delaware, New Jersey, and Maryland topping our list.
Between 2018 and 2022, 16 major internet providers in the US saw speeds trending upward, with many reaching 150 Mbps across the board.

Digital divide leads to slower speeds
We’ve talked about it before: the digital divide is stark and felt most in rural areas of the country. Why is that? Rural areas tend to have lower population densities and, thus, fewer providers delivering fast internet.
- All of the states in our top 10 include major metropolitan areas or business interests that lead to better internet infrastructure.
- Rural states, on the other hand, have a harder time securing faster internet due to a lack of providers and infrastructure.
Our colleagues at CableTV.com used FCC stats to look at this more and found that better provider coverage overlapped with high-population areas
We’re using the internet more than ever before nowadays, with work and social lives commingling online—maybe that’s not a surprise to you if you’re reading this report during work. We were surprised at what people wanted to do online versus in-person.
- People prefer the virtual world for banking, paying bills, ordering food to-go, and scheduling appointments.
- Job interviews, socializing with friends and coworkers, and attending doctor appointments are all things Americans would rather do in person.
Still, even with the urge to go out into the world, 60% of respondents say they still stay home more than they did before the pandemic. And we found that, while staying home, many Americans’ participation in online activities increased significantly compared to the year before:
- Streaming movies, TV, and videos (up 48% vs. 2021)
- Online shopping (up 47%)
- Video chatting (up 44%)

Changing digital habits and more time online
Americans spend about 8 hours online every day and their internet usage is still increasing, according to a survey we recently conducted.
- While online, people listen to an average of 5 hours of streaming music, podcasts, or other audio each day.
- And instead of going to the store to window shop, 75% of Americans research purchases online first.
The increasing time online is also changing Americans’ digital habits, with roughly 50% of Americans reporting symptoms of digital hoarding.
- When using the internet on the computer or their phone, respondents had an average of 7 tabs open at once.
- Over 60% of respondents experience internet speed issues, which may be a result of the multiple windows and tabs open at the same time.
Staying online outside of the home
Public Wi-Fi is a must for half of Americans, who use it when out of the house to cut down on cellular data usage.
- Many people also use public Wi-Fi for remote work and content streaming.
- Nearly 10% of Americans use public Wi-Fi because it’s better than the available Wi-Fi at their home.
Most people connect to free or public Wi-Fi at a:
- Cafe or restaurant (53%)
- Fast food joint (50%)
- Local public library (47%)
How about getting online while traveling?
- 64% of Americans consider internet speed when booking a vacation stay.
- Four out of five respondents reported that Wi-Fi is essential or very important on vacation.
Most people aren’t doing work on the internet on vacation…
- Two out of three use it for social media.
- Another two-thirds use it to stay connected with family and loved ones.
- 65% stream music, movies, and TV shows online.
Internet costs for remote work
Since the pandemic introduced remote work to the broader community, many Americans have been working from home for the better part of three years. That doesn’t mean they’ve perfected it though. Nearly two-thirds of Americans have spent the majority of a video call staring at themselves while a third admitted to being drunk or high during work!

Are remote workers satisfied with their internet? The resounding answer is no.
- Remote work requires the internet and 67% of remote workers think their employer should cover their internet costs while they work from home.
- If employers cover internet plans for remote workers, 75% say they would upgrade their internet plan. (Right now the upgrade is a financial pressure for most workers.)
- It might be fortuitous for employers to provide a stipend: bad internet connections prevented 80% of remote workers from getting work done. That’s money left on the table.
Overall, customer satisfaction is above average for national internet providers.
- We saw widespread satisfaction across the board for internet customers, especially for new technology like 5G home internet.
- Compared to 2022, every satisfaction ranking either went up or stayed the same; however, they are all lower than in 2021, meaning internet service providers still have work to do.
National internet providers scored an average of 3.7 out of 5 on our customer satisfaction survey. T-Mobile has the happiest customers while Earthlink could use some work for next year.
- 5G home internet swept to the top of the rankings for the first time—T-Mobile took the lead for customer service, price, and overall satisfaction.
- Although fiber is typically best known for speed, other internet types have been catching up. A cable ISP and a 5G home internet ISP (Xfinity and T-Mobile) took top national spots for speed.
- Fiber customers are the most satisfied, earning top marks for speed, reliability, customer service, and price. In a twist this year, fixed wireless (including 5G home internet) is tied with fiber for most categories.
Price is still a sticking point here, as it was with remote workers, and most customers are not a fan of price hikes on their internet.
- But bundling internet with mobile service is a hit. Customers who bundle internet with mobile are happier than those who don’t—and happier than those who bundle with TV service.

Inflation put a dent in the paycheck of many Americans this year, and people may be looking for ways to save money on internet. According to our 2022 survey, US internet users who switched internet providers in the past three years cited high cost as their reason for leaving their internet provider.
- 46% of Americans say if they could change one thing about their internet plan, it would be lowering the cost.
- One in three Americans switched their internet plan because the previous plan was too expensive.
- Internet customers are looking for lower prices, faster speeds, better reliability, and protection from unexpected costs.
Many Americans struggle to pay for internet each month and look for less expensive options.
- However, unreliable internet is a dealbreaker.
- And 37% of Americans report needing faster internet.
There is not a lot of love for internet providers. Over half of Americans feel they have been taken advantage of by internet providers.
- Many customers also feel that internet plans are purposefully confusing.
- Nearly two-thirds of respondents find shopping for internet to be confusing, at least sometimes.
- 92% of Americans think internet providers should be required to add broadband labels to their plans.
According to Americans, the perfect internet plan is a 610 Mbps fiber connection for $49 per month. It’s really as simple as that.

We’re hoping to see more providers offer cheaper plan options without sacrificing internet speed or reliability. The big question is, Will providers expand their coverage to rural areas so the states with the slowest internet speeds can catch up to the fastest states?
Our customer satisfaction survey showed that most people are happy with the speed and reliability of their coverage, and we’d love to see that trend continue. As more Americans go online to stay connected, stream media, and work, we hope that internet providers work to make it equitable for everyone.
Sources
All of our sources for HighSpeedInternet.com’s State of the Internet report are previous reports from the past year. They each have their own individual methodologies—from speed tests to surveys—that are available at the bottom of each report. All of the data is proprietary and from HighSpeedInternet.com’s own research and surveys.
- Peter Holslin, HighSpeedInternet, “The 10 Fastest and Slowest States for Internet Speeds in 2022,” April 13, 2022. Accessed January 10, 2023.
- Peter Holslin, HighSpeedInternet, “The Fastest Internet Providers in 2022,” January 9, 2023. Accessed January 10, 2023.
- Peter Christiansen, HighSpeedInternet, “2022 Internet Usage Report,” September 26, 2022. Accessed January 10, 2023.
- Alex Kerai, HighSpeedInternet, “2 in 3 Americans Say Digital Files Lead To Stress or Anxiety,” November 16, 2022. Accessed January 10, 2023.
- Laura Leininger, HighSpeedInternet, “2022 Public Wi-Fi Statistics: How do we use it and is it safe?” August 1, 2022. Accessed January 10, 2023.
- Peter Holslin, HighSpeedInternet, “80% of Americans Can’t Live without Wi-Fi on Vacation,” August 8, 2022. Accessed January 10, 2023.
- Laura Leininger, HighSpeedInternet, “13 Working From Home Stats You Should Know,” June 27, 2022. Accessed January 10, 2023.
- Austin Aguirre, HighSpeedInternet, “2022 Internet Customer Satisfaction Survey,” September 27, 2022. Accessed January 10, 2023.
- Trevor Wheelwright, HighSpeedInternet, “Americans Say the Perfect Internet Plan is Fiber, $50 a Month, and 610 Mbps,” April 7, 2022. Accessed January 10, 2023.
Author - Alex Kerai
Alex began writing for student newspapers and has managed to turn that into a career. During the COVID-19 pandemic, he wrote about small businesses for Biz2Credit and Business.org. Before that, he spent time in communications for higher education institutions, created marketing materials for nonprofits, and worked for entertainment companies in Los Angeles. Today, he reports on emerging consumer trends and his work can be seen on Business.org, Reviews.org, WhistleOut.com, SatelliteInternet.com, and CableTV.com. When he's not writing, Alex watches too much TV, plays guitar, reads and writes fiction, and goes on nature walks.
Editor - Aaron Gates
Related Posts